

PROCESS MONITORING AND ANALYTICS
Process monitoring and operational analytics
An orchestrated process is only as good as your ability to see it running. Once a workflow spans human tasks, system calls, and automated steps, performance degrades in ways no one notices until a customer complains: a queue silently backs up, an SLA timer expires unwatched, an exception path becomes the busy path. Process monitoring and analytics puts a live operational lens on your workflows, tracking the KPIs, SLAs, and exceptions of processes running inside your business process management platform, so operations acts on what is happening now.
- Live KPI, SLA, and queue health across every orchestrated case
- Alerting on breach risk, aging cases, and exception spikes
- Role-based dashboards for operators, supervisors, and owners
The dashboard looks green while a single stage quietly falls behind.
These are operational, in-flight failures. They call for a live control room, not a periodic mining audit. Process monitoring and analytics is the operational layer of Business Process Management (iBPMS). It complements Process Performance Monitoring, which mines end-to-end performance across systems, and it depends on the flows built in Workflow Design and Modeling. The focus is the live state of orchestrated work: which cases are at risk right now, and who must act.
SLA breaches accumulate
They pile up at a specific stage while the overall dashboard still looks green. The average hides the stage that is failing.
Work-in-progress piles up
Cases stack at a role or queue as volume outpaces capacity. Backlog is visible only when it is already large.
Exception handling becomes the norm
The exception path quietly overtakes the intended straight-through route. The busy path is not the designed path.
Aging cases stall
Work sits in the middle of the flow, invisible until it ages out. No one owns the case that stopped moving.
Automation hands back to humans
Automated steps return to people more often than designed, eroding straight-through processing. The automation value leaks one handback at a time.
Breach risk goes unseen
Timers expire with no one watching the cases most likely to miss. Intervention only works while there is still time.
Act on what is happening now, not on what a report says happened last month.
A monitoring architecture built on the live state of orchestrated work.
- Instrumentation that emits events, timers, and status from every step and case.
- A KPI and SLA engine computing service levels, throughput, and queue health in real time.
- Operational dashboards with role-based views for operators, supervisors, and process owners.
- Alerts and escalation on breach risk, aging cases, and exception spikes.
- Straight-through rate tracking, so automation value and cost per case stay visible.
- Exception and rework analytics that expose where quality and operational cost leak.
Five steps, from defining success to running the control room.
Map KPIs and SLAs
Define what success means for each orchestrated process, and the thresholds that signal trouble.
Instrument the workflow
Make every step emit the events, timers, and status that monitoring needs.
Build role-based dashboards
Distinct views for operators, supervisors, and owners, each showing the decisions that role makes.
Configure alerting
Escalation on breach risk, aging, and exception spikes, so intervention happens while there is still time.
Operationalise it
Make monitoring drive daily decisions, staffing, and continuous tuning, not just wall displays.
A live control room over the process runtime you already run.
Each layer is instrumented and observable, so the live state of orchestrated work is never a guess.
Figures are placeholders; Softobiz to verify against your environment.
From a monthly report to a live operations view.
Challenge: A [global enterprise client] ran orchestrated processes on [monthly reporting]; SLA breaches and aging cases surfaced only after customers complained.
Result: Live KPI, SLA, and queue dashboards with breach alerting, so operations intervened in-flight and cut aged cases. (Softobiz to verify.)
The rest of the business process management practice.
Business Process Management
The orchestrated iBPMS flows this monitoring layer keeps on target.
Workflow Design and Modeling
The BPMN flows whose steps emit the events monitoring depends on.
Process Automation and Optimization
Turning what monitoring reveals into tuned, automated flows.
End-to-End Process Integration
The connective fabric that lets processes span every system.
Process Performance Monitoring
Mining end-to-end performance across systems over time.
Intelligent Automation
The practice all of these capabilities sit within.
What operations leaders ask us first.
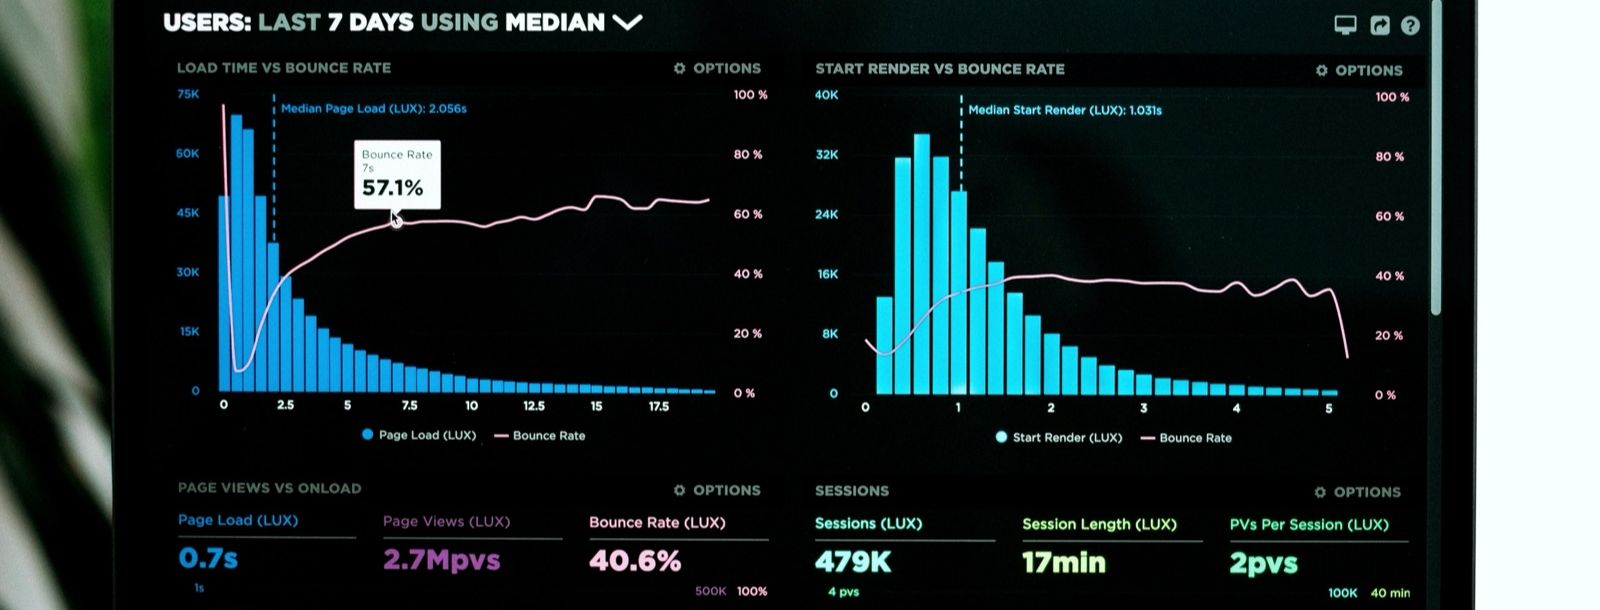
This tracks live KPIs, SLAs, and exceptions on processes actively orchestrated by an iBPMS, a real-time operations view. Process Performance Monitoring uses process mining to measure the true end-to-end flow across systems over time. One runs the control room; the other studies the whole journey.
We instrument what emits events. For workflows outside an orchestration engine, we combine business activity monitoring with mining-based measurement to give comparable visibility.

Put SLA, queue, and exception visibility on your orchestrated workflows, and turn it into daily action.
A live control room over the processes running inside your business process management platform.